Getting the Nikkei VI and the Fear & Greed Index in my inbox every morning
Here is what this post covers:
- Introduction
- The email
- What the Nikkei VI is
- What the Fear & Greed Index is
- Running it every morning with a GitHub Actions schedule
- How to use it
- Wrapping up
Introduction
I didn’t have anything in particular I wanted to build. I just found it tedious to check the indicators I look at every day, so I made a tool that collects them into an email and sends it to me daily.
The two I watch are the Nikkei VI, which shows how nervous the Japanese stock market is, and CNN’s Fear & Greed Index, which shows the mood of the US stock market. Both are a page visit away in a browser, but going around two sites every day adds up.
market-sentiment-monitor fetches these two, plus the Nikkei 225 itself, every morning and sends them in a single email. It runs on GitHub Actions, so there is no server to keep around.
This post explains what the two indicators measure, how the GitHub Actions schedule that runs it each morning works, and how to set it up.
The email
Around 9:30 every morning (Japan time), an email like this arrives. The body is in Japanese; the labels are “change from the previous day / 1 week / 1 month / 1 year ago”.
Subject: Fear & Greed 31: Fear

😨 Fear & Greed Index: 31 — Fear(恐怖)

前日比: +3.1(28)
1週間前比: -5.8(37)
1ヶ月前比: -14.9(46)
1年前比: -23.4(55)

(2026-10-03 08:59 JST 時点)

────────────────

📊 日経平均VI: 22.58(2026-10-02 終値)

前日比: -0.34(22.92)
1週間前比: +2.28(20.30)
1ヶ月前比: -2.97(25.55)
1年前比: -2.71(25.29)

🗾 日経平均株価: 68,309円(2026-10-02 終値)

前日比: -0.9%(68,957円)
1週間前比: +2.9%(66,364円)
1ヶ月前比: +6.2%(64,326円)
1年前比: +52.0%(44,937円)
The value in parentheses is the value at the point being compared against.
Below each set of numbers is a chart. Each one overlays a stock index with its indicator, so you can see at a glance how the indicator moved when prices fell. These are the two charts from an actual email:
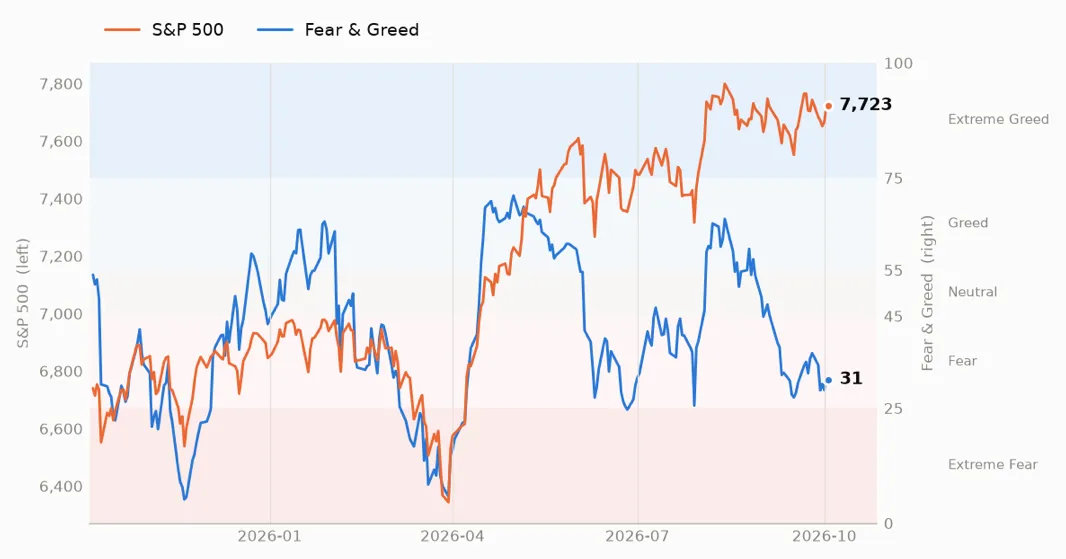
The first shows the S&P 500 (orange, left axis) and Fear & Greed (blue, right axis) over the past year. The colored bands in the background are the five ratings, from Extreme Fear at the bottom to Extreme Greed at the top. When the S&P 500 fell below 6,400 in April 2026, Fear & Greed dropped into Extreme Fear too, and it climbed back to Greed as prices recovered. Right now the S&P 500 is near its highs at 7,723, while Fear & Greed sits at 31, in Fear.
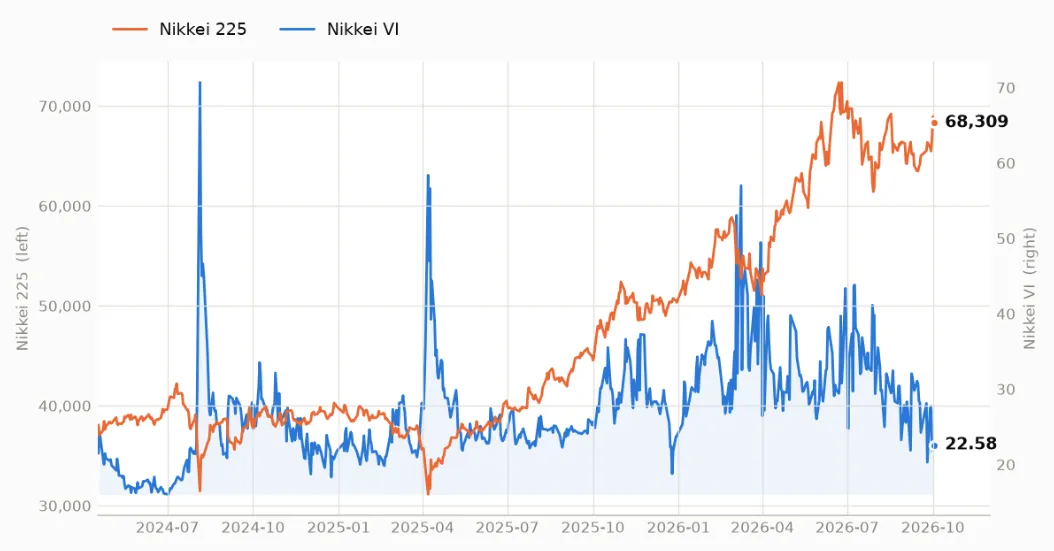
The second shows the Nikkei 225 (orange, left axis) and the Nikkei VI (blue, right axis) over the past two and a half years. You can see the Nikkei VI spike in August 2024 and April 2025, when the Nikkei 225 fell sharply. Over the two and a half years the Nikkei 225 rose from around 40,000 yen to around 70,000 yen; the latest close is 68,309 yen, with the Nikkei VI at 22.58.
On days when the Fear & Greed rating (Extreme Fear through Extreme Greed) changes from the last run, the subject line starts with a “rating changed” tag. Just scanning subjects in the inbox is enough to notice that the mood shifted.
What the Nikkei VI is
The Nikkei VI is an index of how much the market expects the Nikkei 225 to move over the next month. It is calculated from Nikkei 225 futures and options prices and published by Nikkei Inc. It is the Japanese counterpart of the US VIX, and is sometimes called a “fear index” too.
The higher the value, the bigger the price swings investors are expecting. In calm markets it tends to hover around 20, and it jumps when stocks drop sharply. In the second chart above you can see it climbing to around 60–70 during the crash of August 2024 and the tariff shock of April 2025, and to around 60 again around March 2026.
The VI measures the size of expected moves, not their direction. It would also rise if a big rally were expected. In practice, though, it almost always spikes during sell-offs, so it is used as a gauge of anxiety.
What the Fear & Greed Index is
The Fear & Greed Index is published by CNN and expresses the mood of the US stock market as a number from 0 to 100. Close to 0 means fear (pessimism), close to 100 means greed (optimism).
It is an equal-weighted average of these seven indicators:
| Indicator | What it looks at |
|---|---|
| Market momentum | The S&P 500 versus its 125-day moving average |
| Stock price strength | Stocks hitting 52-week highs versus 52-week lows |
| Stock price breadth | Trading volume in rising stocks versus declining stocks |
| Put/call ratio | Trading volume of puts (the right to sell) versus calls (the right to buy) |
| Junk bond demand | The yield spread between junk bonds and investment-grade bonds |
| Market volatility | The VIX and its 50-day moving average |
| Safe haven demand | The difference between stock and Treasury returns over the last 20 trading days |
The score is split into five ratings. Roughly:
| Score | Rating |
|---|---|
| 0–24 | Extreme Fear |
| 25–44 | Fear |
| 45–55 | Neutral |
| 56–75 | Greed |
| 76–100 | Extreme Greed |
So that the tool never disagrees with CNN about which side of a boundary a score falls on, it doesn’t compute the rating itself. It uses the rating CNN returns as is.
The Nikkei VI only looks at expected swings in Japanese stocks, while Fear & Greed is a composite that also takes in US stock momentum and the bond market. Putting the two side by side also makes it easy to spot days when sentiment in Japan and the US diverges.
Running it every morning with a GitHub Actions schedule
GitHub Actions has a trigger called schedule that runs a workflow at fixed times. The syntax is the same as Linux cron. The tool’s workflow (.github/workflows/notify.yml) uses this:
on:
  schedule:
    # Every day at 00:30 UTC (09:30 JST)
    - cron: "30 0 * * *"
  workflow_dispatch:
The five fields of cron are, from left to right, minute, hour, day of month, month, and day of week. * means “every”, so 30 0 * * * is “every day at 0:30”. workflow_dispatch is the trigger that lets you start it by hand with the Run workflow button in the Actions tab.
A scheduled workflow differs from ordinary cron in a few ways.
First, times are interpreted as UTC. I want 9:30 in Japan, so I subtract nine hours and write 0:30. Since March 2026 you can set a time zone with the timezone key, so you can also write it in Japan time like this:
on:
  schedule:
    - cron: "30 9 * * *"
      timezone: "Asia/Tokyo"
Second, it doesn’t necessarily run on the dot. When GitHub is busy, runs can be delayed by a few minutes up to tens of minutes, and the top of every hour is especially crowded. The tool avoids minute 0 and runs at minute 30. For something that arrives once a day, a bit of delay doesn’t matter.
Third, in public repositories, scheduled workflows are disabled automatically after 60 days without activity. Each time the tool sends an email it saves the latest values to state/state.json and commits it, so there is a commit every weekday and it never gets disabled.
The saved values serve two purposes. One is detecting whether the Fear & Greed rating changed. The other is avoiding duplicates. On weekends and holidays you only get the same data as the previous trading day, so if both the Fear & Greed data and the Nikkei data are unchanged from last time, the run exits without sending anything.
Put together, each run does the following:
- Fetch the Fear & Greed data from CNN, and the Nikkei VI and Nikkei 225 CSVs that Nikkei distributes on its official site
- Compare with
state/state.jsonand stop if the data is the same as last time - Build the body and charts (PNGs drawn with matplotlib) and send them over Gmail SMTP
- Write the new values to
state/state.jsonand commit
Fear & Greed has no official API, so the tool reads the JSON that CNN’s page fetches behind the scenes. That could change without notice, but if fetching fails the job fails, and GitHub sends a failure email, so I’d notice.
How to use it
Fork the repository or copy it into your own. There are three steps:
- Turn on 2-Step Verification for the sending Google account and create an app password
- Register the secrets under Settings → Secrets and variables → Actions in the repository
- Pick
Fear & Greed notifyin the Actions tab, start it with Run workflow, and check that the email arrives
These are the three secrets to register:
| Secret | Value |
|---|---|
MAIL_USER | The sending Gmail address |
MAIL_APP_PASSWORD | The app password you created (16 characters, no spaces) |
MAIL_TO | The recipient address (defaults to MAIL_USER if omitted) |
If you tick force when running it by hand, it sends the email even if the data hasn’t changed since last time. That’s handy for testing on a weekend. If you forked the repository, you also need to enable workflows in the Actions tab.
To change when it arrives, edit the cron in notify.yml. The current 9:30 was picked so that the US closing values are final by the time it fetches them.
The Nikkei CSV carries a note saying the data is Nikkei’s copyrighted work and may not be reproduced without permission. Keep it to emailing yourself for personal reference, and don’t commit the fetched data to the repository or send it on to other people.
Wrapping up
I set things up so the Nikkei VI and the Fear & Greed Index arrive in one email every morning. The Nikkei VI is how much Japanese stocks are expected to move, and Fear & Greed turns the mood of the US market into a number built from seven indicators.
With a GitHub Actions schedule you can run something at a fixed time every day without setting up a server. Keep three things in mind: times are interpreted as UTC, runs can be tens of minutes late, and the schedule stops after 60 days without activity. For a once-a-day notification, that’s all you need.